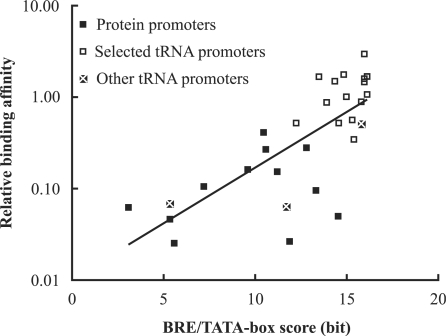
Figure 6.
Correlation between promoter BRE/TATA-box score and transcription factor binding. The ‘selected’ tRNA promoters were identified by the in vitro selection (18). The ‘other’ tRNA promoters were identified computationally (32). The vertical position of a point indicates the effectiveness of a promoter, relative to the M. vannielii tRNAVal promoter, in competition for TBP/TFBc. The horizontal position is its BRE/TATA-box score. The correlation coefficient (r) is 0.75, indicating a positive correlation. The equation for the regression line is log2(relative binding affinity) = 0.40 × (BRE/TATA-box score) – 6.60.

