Figure 3.
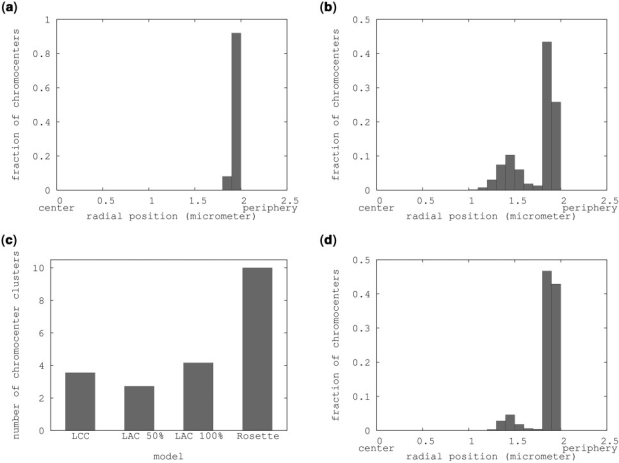
Chromocenter localization and clustering. (a) Histogram showing the fraction of chromocenters in each radial position bin in a LCC model simulation. (b) Distribution of chromocenter radial positions in the Rosette model. (c) Clustering analysis on the simulations of (a and b) showing the average amount of chromocenter clusters in each simulation. (d) Distribution of chromocenter radial positions in the rosette model including a 1.5 μm nucleolus.

