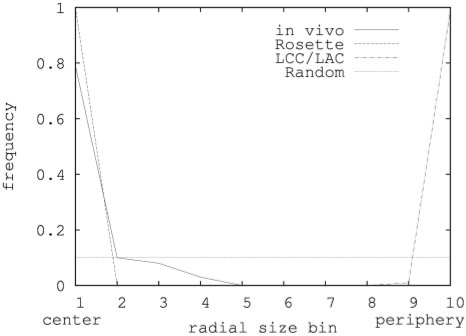
Figure 4.
Nucleolus positions in Arabidopsis. On the horizontal axis nucleolus position bins are shown each representing a shell of 0.1 times the nuclear volume available to the nucleolus. On the vertical axis, the fraction of nucleoli in each bin is shown. The solid line shows measured positions in A. thaliana mesophyl nuclei, the dashed line shows the prediction derived from the Rosette model, the line with alternating dashes and dots shows predictions from the LAC model, and the dotted line shows random localization (assuming the nucleolus to have an equal chance to localize to every available position in the nucleus).

