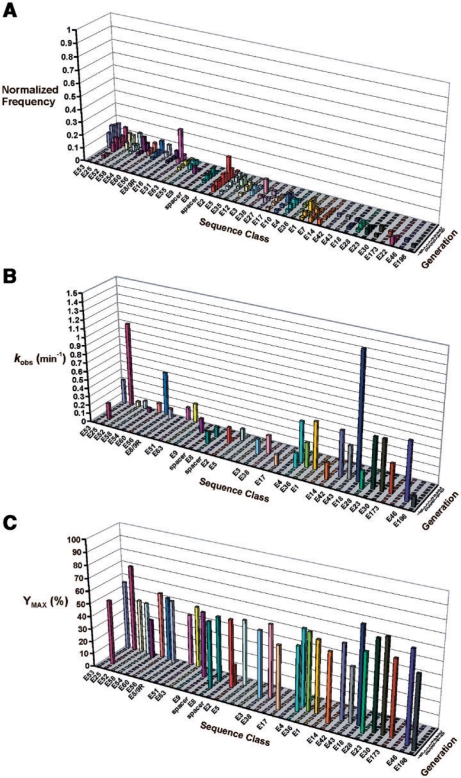
Figure 5.
The fitness and phenotypic landscapes of selection experiment B. (A) The fitness landscape adapted from ref. 19, shows changes in the frequency of specific DNAzyme sequence classes over multiple generations of in vitro selection. The number of clones observed in each sequence class was normalized to the total number of clones sequenced per generation. Sequence classes were arbitrarily arranged in an order that illustrates the evolutionary succession between competing classes, but is not intended to reflect any sequence homology. Blank ‘spacer’ intervals were inserted into the graph to provide an unobstructed view of certain classes. Sequence class E8/9R is labeled as such, because it is the suspected recombination product of class E8 and E9 (19). (B) Catalytic rate constants are shown for a representative sample of 34 DNAzyme clones isolated from different sequence classes and different generations of the selection experiment. The spatial arrangement and order of sequence classes from the fitness landscape in (A), have been preserved in this graph to facilitate comparison. Rate constants ranged in value from 0.02 min−1 (E2–G21) to 1.44 min−1 (E18), with no inactive clones. (C) Maximum cleavage yields (Ymax) corresponding to the same DNAzyme clones reported in (B) are shown.

