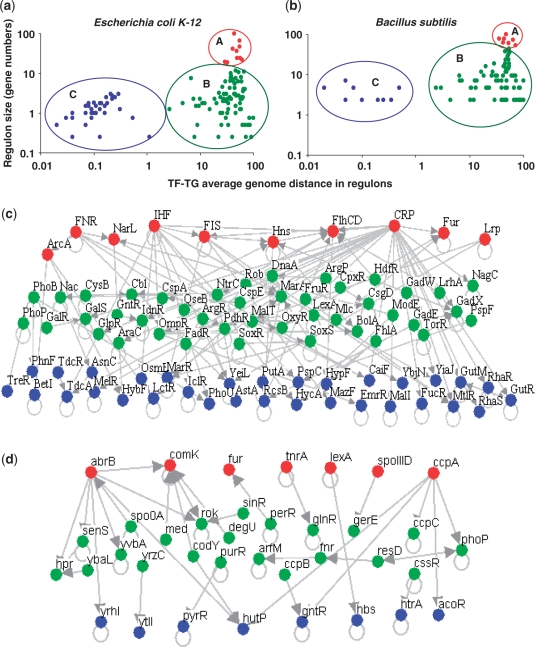
Figure 1.
Relationship between size (defined as the number of target genes) and average chromosomal distance for all known regulons in (a) E. coli and (b) B. subtilis. Regulon size is plotted on Y-axis and is normalized with respect to size of the biggest regulon in each genome for the sake of comparison across genomes and the average chromosomal distance between the TF encoding gene and their respective target genes is shown on X-axis. Chromosomal distances were calculated as defined earlier (21) with the maximum distance being half the number of protein coding genes on a circular chromosome. Note that both regulon sizes and average chromosomal distances are normalized with respect to the maximum and both the axes are shown on a logarithmic scale. Flow of regulatory interactions between the TFs heading the regulons, grouped according to their size and chromosomal distance in (c) E. coli and (d) B. subtilis; it can be noted that the regulatory flux among TFs typically follows the order, big to intermediate to small regulons, coloured respectively in red (big), green (intermediate) and blue (small).

