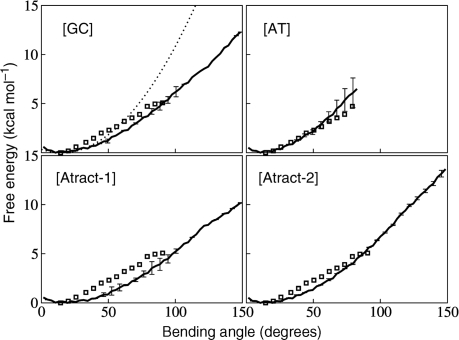
Figure 1.
Calculated free energy for bending the four DNA oligomers are plotted for 3 ns sampling per 5° window (bold full lines), with corresponding error bars. The bending free energy deduced from AFM experiments (14) is shown by open squares. A quadratic energy function derived from the experimental equilibrium persistence length is shown for the [GC] oligomer (dotted line). Note the departure from quadratic energy variation for larger bending angles.

