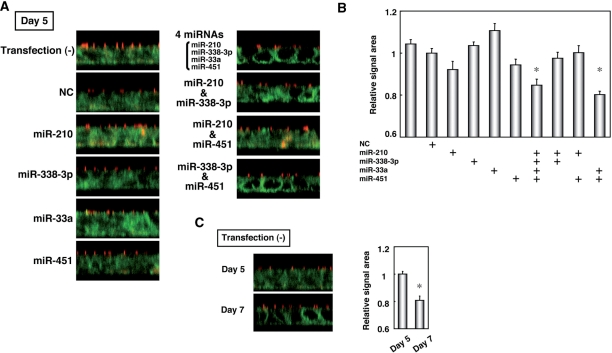
Figure 4.
Effects of overexpression of miR-210, miR-338-3p, miR-33a and miR-451 on the distribution of β1 integrin in the basolateral membrane. (A) T84 cells were transfected with NC or combination of miR-210, miR-338-3p, miR-33a and miR-451 and T84 cells at the Day 5 were stained with the specific antibodies against ZO1 (red) and β1 integrin (green). (B) Quantification of areas with signal intensity of β1 integrin in (A). The values are shown as the fold of values obtained from the sample transfected with NC (Student's t-test: *P < 0.01 versus NC-tansfected cells), and are represented as mean ± SE. (C) Representative fluorescence images of ZO1 (red) and β1 integrin (green) in T84 cells at Day 5 and 7, and quantification of areas with signal intensity of β1 integrin. The values are shown as the fold of values obtained from the sample at Day 5 (Student's t-test: *P < 0.01 Day 7 versus Day 5), and are represented as mean ± SE. The data are a representative of three independent experiments.

