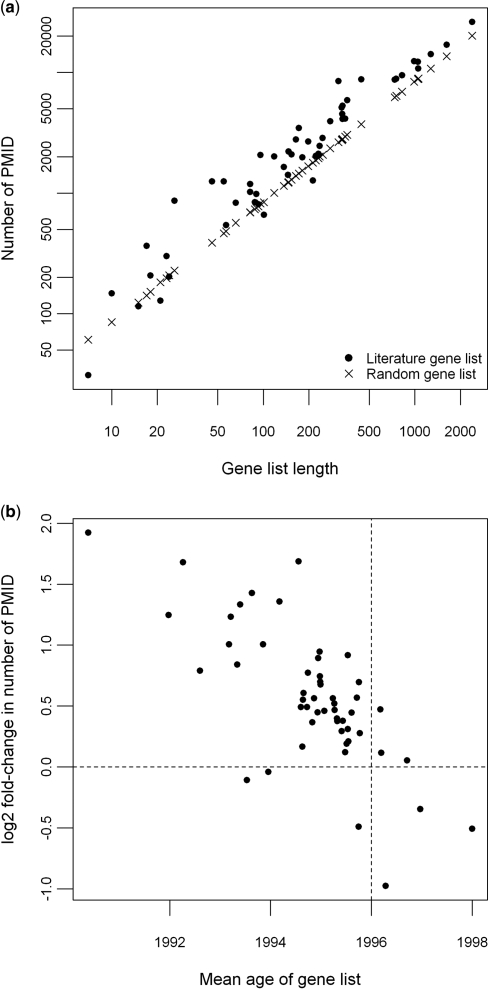
Figure 1.
The relationship between annotation bias and gene age. (a) 52 gene lists from the HG-U133A chip were collated from published literature and for each of these equivalently sized random gene lists were created. The numbers of PMIDs associated with them were calculated and plotted against the size of the gene lists. Both axes are on logarithmic scale. (b) A mean age was calculated for each of the 52 literature gene lists by averaging the consensus ages of its constituent genes. Fold-change in PMID was calculated by dividing the number of PMIDs associated with a literature gene list by the average PMID count in an equivalently sized random gene list. The vertical dashed line represents the mean age of a random gene list, which is 1996 in this case; the horizontal dashed line represents the level at which there is no difference between the numbers of PMIDs associated with the literature and random gene lists.

