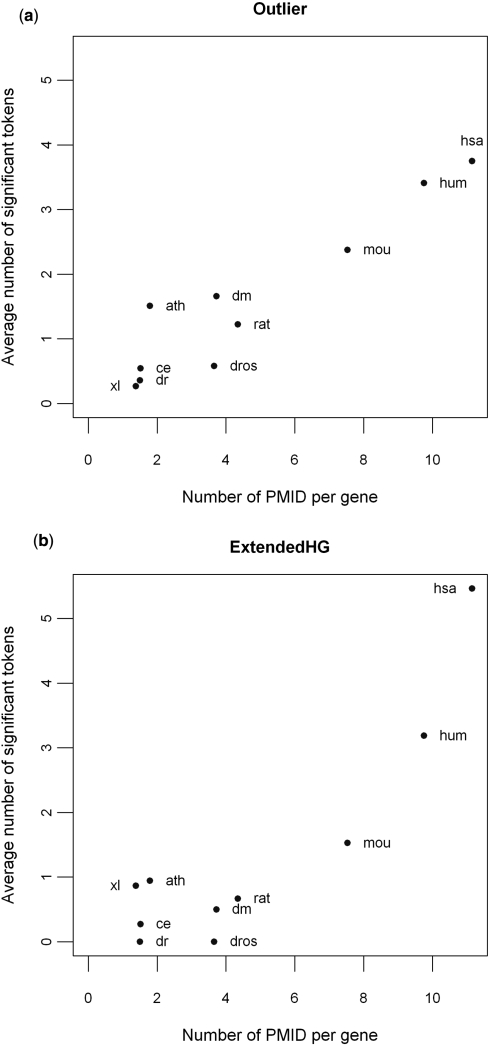
Figure 3.
A comparison of the performance of Outlier (a) and ExtendedHG (b) across different species. The average number of tokens called significant by the two approaches, Outlier and ExtendedHG, is plotted against the annotation density (i.e. number of PMID per gene) for experimentally derived gene lists that were performed on 10 Affymetrix platforms representing eight different species, including HG-U133A (hsa), HG-U133 Plus 2.0 (hum), Mouse 430 2.0 (mou), Rat 230 2.0 (rat), Arabidopsis ATH1 (ath); DrosGenome1 (dm), Drosophila 2.0 (dros), Xenopus laevis (xl), C. elegans (ce) and Zebrafish (dr).

