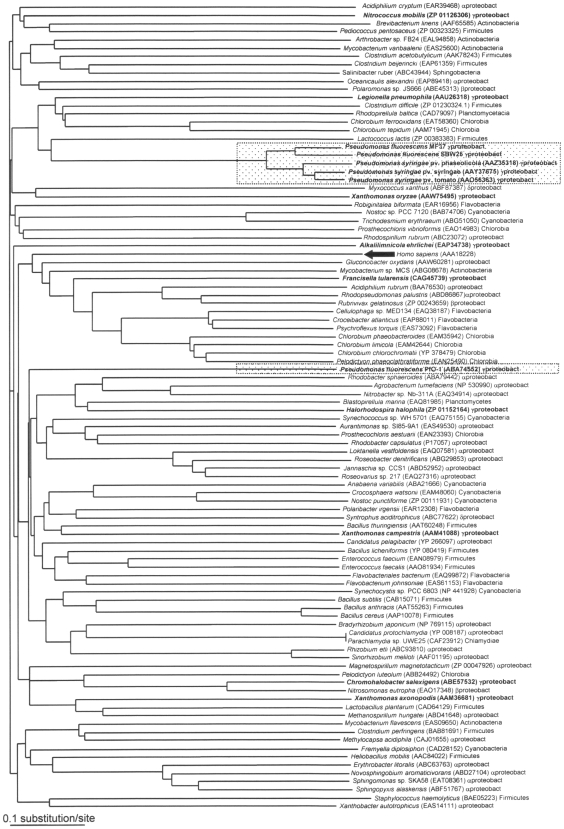
Figure 3. Amino acid sequence cladogram showing the relationships between bacterial TSPO.
Bacterial names, accession numbers, and taxonomic groups are indicated for each branch. Bold characters indicate γ-proteobacteria, and the black arrow indicates the position of TSPO expressed in human mitochondria. The two dotted boxes indicate fluorescent Pseudomonas strains containing a bactTSPO gene (P. fluorescens and P. syringae). The degree of statistical support for branches was determined with 1000 bootstrap replicates. All branches showed less than 30% divergence.

