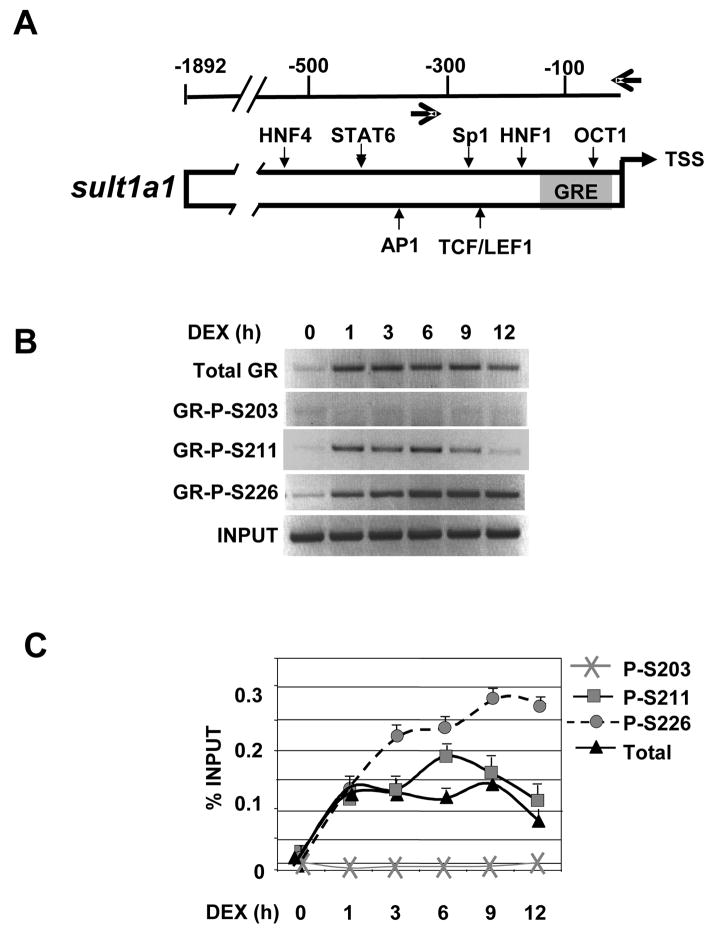
Figure 4. GR phospho-isoform recruitment to sulfonyl transferase 1A1 (sult).
A) Schematic depiction of the sult regulatory region. The single promoter proximal GR binding site is shown as a gray box. The small vertical arrows show other transcription factor binding sites. The large horizontal arrows depict the primers pairs used to amplify the region that flank the GRE. B–C) Phospho-GR recruitment to sult over 12 h. Rat hepatoma cells were treated with vehicle or Dex for the times indicated and ChIP were performed with antibodies against total GR, P-S203, P-S211, P-S226 and GR binding sites were amplified by PCR using sult -specific primer pairs and the PCR products resolved, stained and quantified as in Figure 3.

