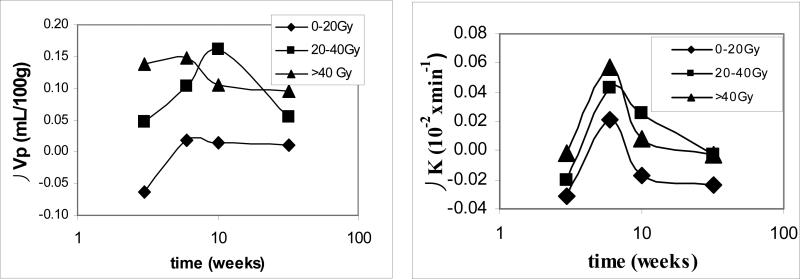
Figure 1.
The differences in the vascular volumes (Vp) and blood-brain barrier permeability (Ktrans) in three dose intervals at three observation times compared to the baseline values. In the high dose region (> 40 Gy), the vascular volumes increased significantly at week 6 during the course of RT and then started decreasing after the completion of RT; while in the intermediate dose interval (20−40 Gy), the vessel volume increased slowly, reached the similar maximum value 1 month after the completion of RT, and then started decreasing. The changes in the blood-brain barrier permeability were significant in the high and intermediate dose regions at week 6 during the course of RT. 10 weeks: 1 month after the completion of RT; and 32 weeks: 6 months after the completion of RT.

