
Figure 1.
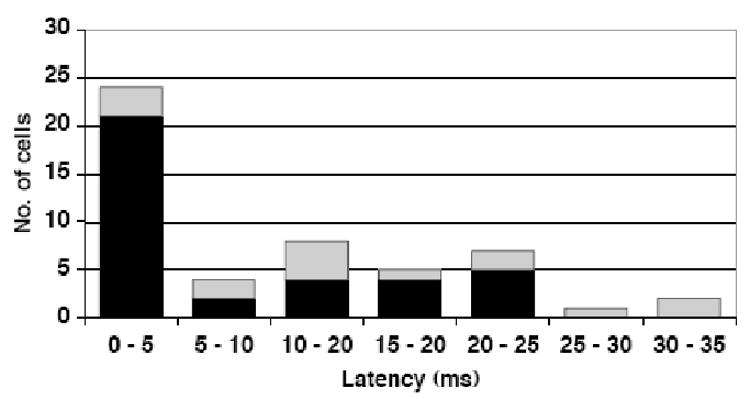
Frequency distribution of latencies of evoked response to electrical stimulation of the CT nerve in all NTS cells recorded (n = 51). Black bars indicate taste-responsive cells; gray bars indicate non-taste-responsive cells.
Official websites use .gov
A
.gov website belongs to an official
government organization in the United States.
Secure .gov websites use HTTPS
A lock (
) or https:// means you've safely
connected to the .gov website. Share sensitive
information only on official, secure websites.
Frequency distribution of latencies of evoked response to electrical stimulation of the CT nerve in all NTS cells recorded (n = 51). Black bars indicate taste-responsive cells; gray bars indicate non-taste-responsive cells.