


Figure 3.
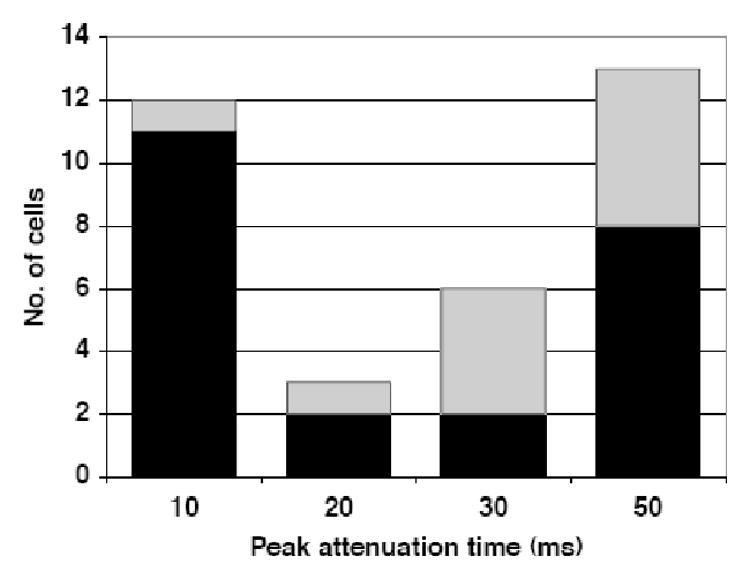
Frequency distribution of peak time of paired-pulse attenuation. Peak attenuation is defined as the interpulse interval at which the greatest percent decrement in the number of evoked pulses occurred between the conditioning and test pulses. Overall there was a bimodal distribution, especially for taste-responsive cells; however, for non-taste-responsive cells, the distribution was skewed toward longer interpulse intervals. Black bars indicate taste-responsive cells; gray bars indicate non-taste-responsive cells.