
Figure 4.
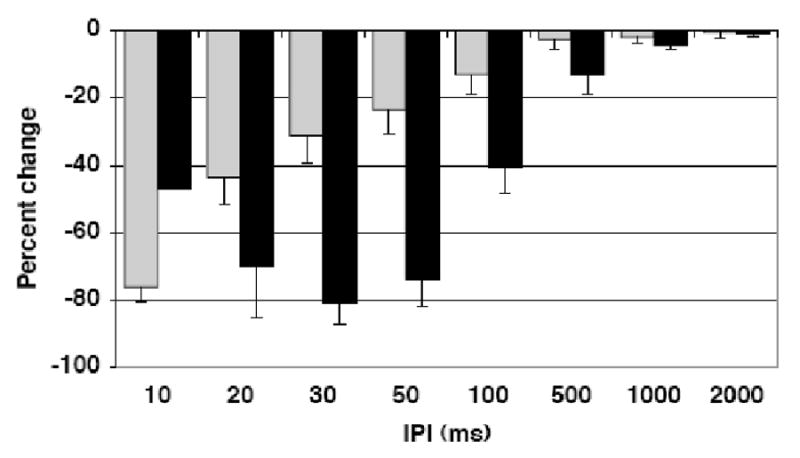
Time course of paired pulse attenuation in NTS cells that showed early and late peak attenuation. Shown is the percent difference (± SEM) in the number of evoked spikes in response to CT nerve stimulation following the conditioning pulse compared with the test pulse at various interpulse intervals. Cells with early peak attenuation show short lived time-dependent inhibition but cells with later peak attenuation show a gradual decline in time-dependent inhibition. Black bars show cells with early peak attenuation (≤ 20 ms); gray bars show cells with late peak attenuation (≥ 30 ms).