
Figure 5.
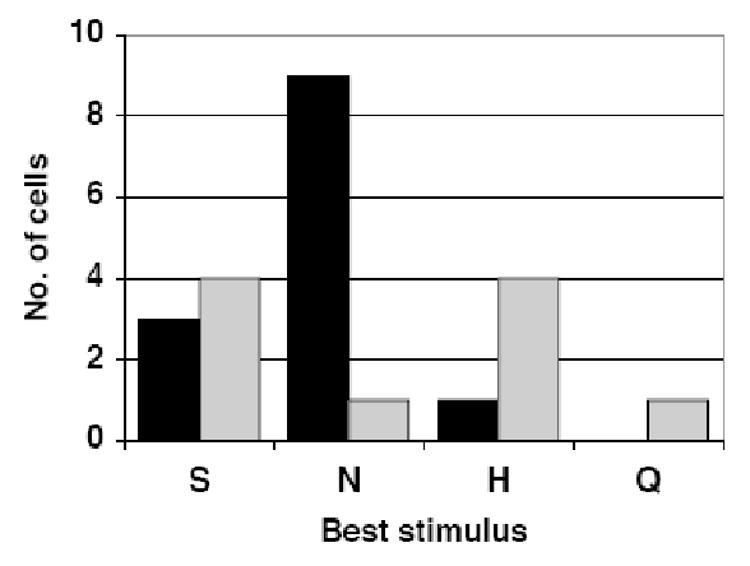
Distribution of “best taste stimuli” among cells that showed early and late peak attenuation. Cells with early peak attenuation showed the greatest paired pulse attenuation at IPIs ≤ 20 ms and are indicated with black bars. Cells with late peak attenuation showed the greatest paired pulse attenuation at IPIs ≥ 30 ms and are indicated by gray bars. The best taste stimulus was defined as the tastant that evoked the largest response among those tastants tested.