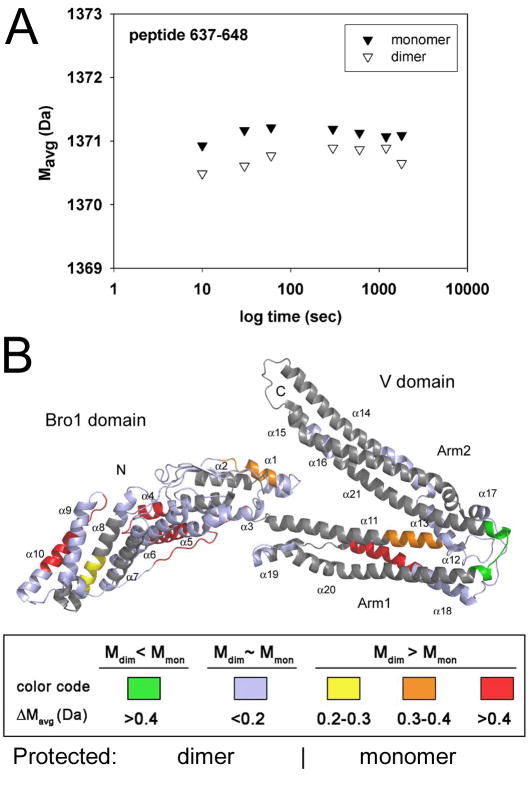
Figure 3. Mapping of the conformational flexibility of ALIXBro1-V.
Hydrogen/deuterium (H/D) exchange labeling coupled to mass spectrometry analysis was used to determine conformational differences between monomeric and dimeric ALIXBro1-V. (A) Example of local H/D exchange kinetic for the peptide sequence 637–648. The average mass (Mavg) is plotted against D2O incubation time. This reveals a difference in H/D exchange within this region where dimeric ALIXBro1-V shows less deuterium exchange compared to monomeric ALIXBro1-V over a period of 30 min.
(B) The H/D exchange results have been plotted onto the structure of ALIXBro1-V (Fisher et al., 2007) and the differences in deuteration between monomer and dimer (ΔMavg) are scored according to the following color code: green regions are more protected from H/D exchange in dimeric ALIXBro1-V while regions shown in red < orange < yellow are less accessible to H/D exchange within monomeric ALIXBro1-V. Regions in blue show similar accessibility between monomeric and dimeric ALIXBro1-V and regions in grey were not covered by peptide mapping of the deuterated forms.

