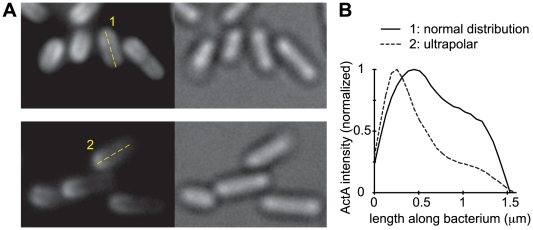
Figure 1. Ultrapolar bacteria display greater degree of polarity than normal bacteria.
A) Images of normal (top) and ultrapolar (bottom) bacteria expressing ActA-RFP. Left panels show ActA signal, right panels show bright-field illumination. B) ActA intensity linescan of one normal and one ultrapolar bacterium labeled in A. The average intensity over the width of the bacterium is plotted at each point along its length. Intensities are normalized to the maximum in the linescan. Ultrapolar ActA bacteria display relatively less ActA along the sides than normal ActA bacteria.

