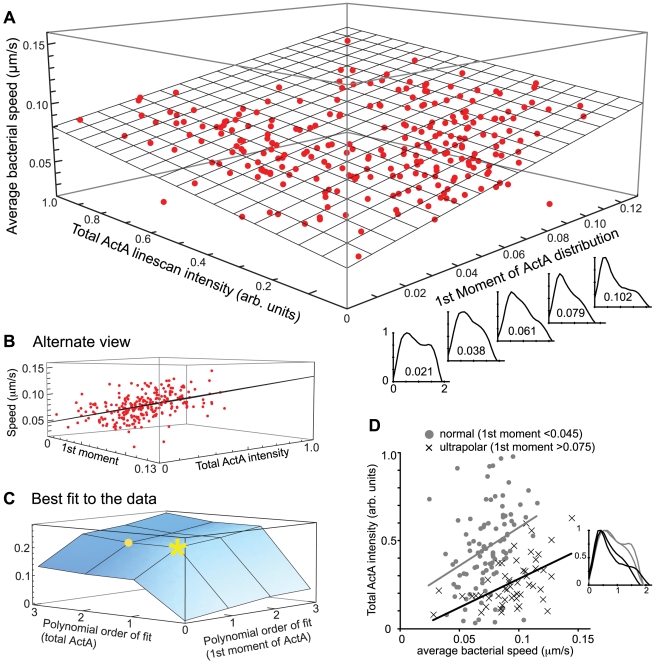
Figure 2. Bacterial speed increases with increased ActA polarity and intensity.
A) 3-dimensional plot of the average experimentally measured bacterial speed vs. its 1st moment and total ActA linescan intensity. The linescan graphs along the bottom right axis display the ActA distribution for respective 1st moment values (intensity normalized to the maximum to highlight how the 1st moment describes degree of polarity). The larger the 1st moment, the greater the degree of polarity in ActA distribution. The total ActA intensities span a ten-fold range. Actual data points are shown in red. The best-fit plane is shown in gray. Speed increases with both ActA polarity (1st moment) and ActA intensity. The bacteria that provided the prototypical normal and ultrapolar distributions used in simulations (Fig. 3A) are circled in black. B) A view of dataset shown in A from an alternate vantage highlighting the quality of the fit and scatter around the best-fit plane. C) 3-dimensional plot of the R2 residual values obtained when fitting the data shown in A by functions of increasing polynomial degree. The numbers on the x- and y-axes represent the highest polynomial degree of the function used for the fit. For example, the small round point at “2” on the ActA intensity axis and “1” on the 1st moment axis represents the R2 value for the fit Z = a+bX+cX2+dY where Z is the speed, a, b, c, and d are fitting constants, X is the ActA intensity and Y is the 1st moment (a similar plot representing the mixed non-linearities, i.e. where the yellow star would represent the function Z = a+bXY was also considered; data not shown). The greatest increase in R2 occurs for a linear fit in ActA intensity and polarity (yellow star) –higher degree polynomials only marginally improve the fit. This suggests that a linear fit in both 1st moment and ActA intensity sufficiently describes the trend in the data. The plane shown in A and B corresponds to this fit. D) Speed vs. ActA intensity for ultrapolar and normal ActA bacteria. Bacteria were classified into ultrapolar and normal categories based on the value of their 1st moment. Bacteria with 1st moments below 0.045 and above 0.075 could be easily distinguished by eye. Bacteria with intermediate 1st moments (between 0.045 and 0.075) were ignored in this analysis. Normal bacteria are shown as gray circles and ultrapolar bacteria as black crosses. Linescan inset contrasts two examples each of ultrapolar (black) and normal (gray) ActA distributions.

