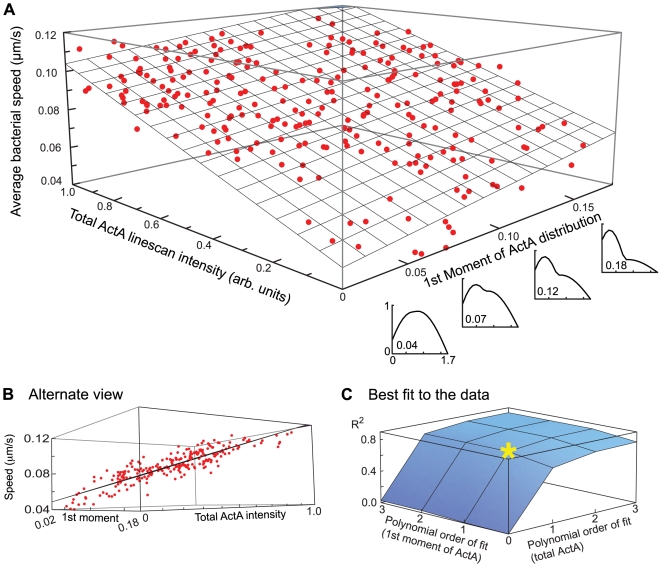
Figure 4. Bacterial speed increases with increased ActA polarity and intensity in simulations that incorporate friction.
A) 3-dimensional plot of the average bacterial speed vs. its 1st moment and total ActA linescan intensity for 253 simulated bacteria. A range of simulated ActA polarities was chosen to correspond to the experimentally observed range (Fig. 2A). Similarly, the total ActA intensities were set to span a ten-fold range as in the experimental data. The linescan graphs along the bottom right axis display the ActA distribution for respective 1st moment values (intensity normalized to the maximum). Actual data points are shown in red. The best-fit plane is shown in gray. B) An alternate view of the dataset shown in A, highlighting the quality of the fit and scatter around the best-fit plane. C) 3-dimensional plot of the R2 value obtained when fitting the data shown in A by functions of increasing polynomial degree. As in Fig. 2C the greatest increase in R2 occurs for a linear fit in ActA intensity and polarity (yellow star) –higher degree polynomials only marginally improve the fit.

