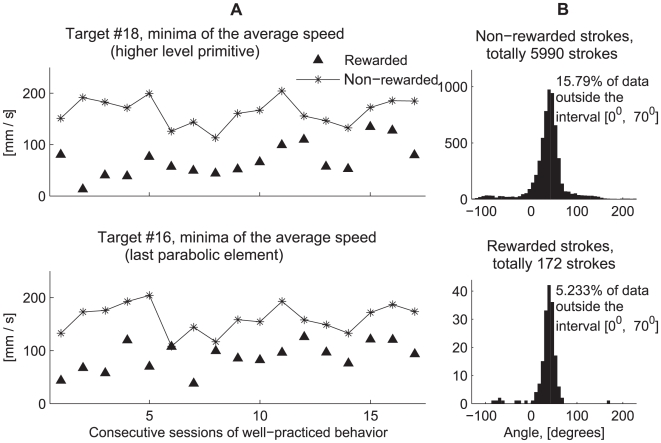
Figure 9. Differences between the rewarded and non-rewarded trajectories, statistical estimates.
Differences between rewarded and non-rewarded trajectories. A. Minimal values of the average tangential velocities of the rewarded and non-rewarded trajectories for the sequence (1–2) which is a higher level primitive (target #18, as in Figure 8C) and for the last parabolic element (target #16, as in Figure 8D). B. Corresponds to parabolic strokes fitted to the trajectories constituting the last parabolic element (ellipses corresponding to target #16, as in Figure 8D). The orientations of 15.8% of the non-rewarded and 5.23% of the rewarded segments were outside the orientation interval [0, 70] degrees. This difference in variability was statistically significant (see text).

