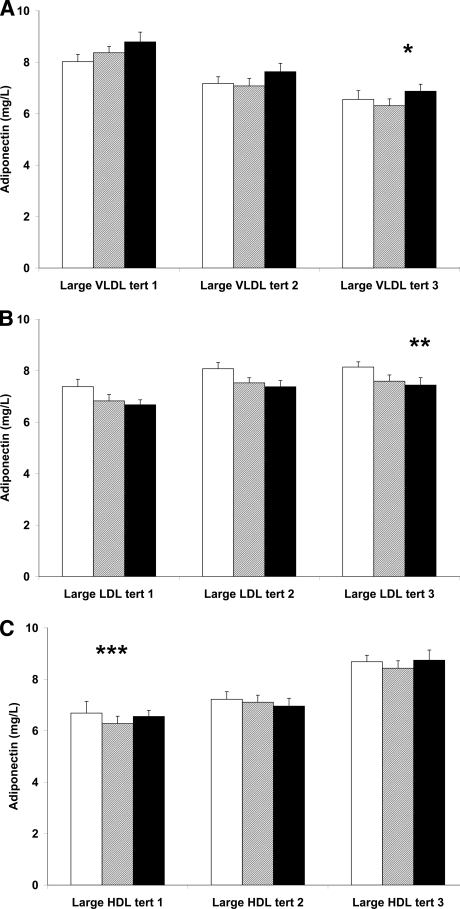
Figure 1.
Adjusted plasma adiponectin concentration as a function of lipoprotein subclass tertiles adjusted for sex, waist circumference, BMI, and HOMA-IR. A: The cohort divided into tertiles of large VLDL concentrations is shown. Each of these tertiles is subdivided into tertiles of small VLDL concentrations. □, the lowest tertile (tert); ▩, the middle tertile; and ■, the upper tertile of small VLDL. B: The cohort divided into tertiles of large LDL concentrations is shown; each of these tertiles is subdivided into tertiles of small LDL concentrations. □, the lowest tertile; ▩, the middle tertile; and ■, the upper tertile of small LDL. C: The cohort divided into tertiles of large HDL concentrations is shown; each of these tertiles is subdivided into tertiles of small HDL concentrations. □, the lowest tertile; ▩, the middle tertile; and ■, the upper tertile of small HDL. *P for trend < 0.001 and 0.02 for large VLDL and small VLDL median tertile values, respectively. **P for trend < 0.001 and 0.009 for large LDL and small LDL median tertile values, respectively. ***P for trend < 0.001 for large HDL median tertile values.

