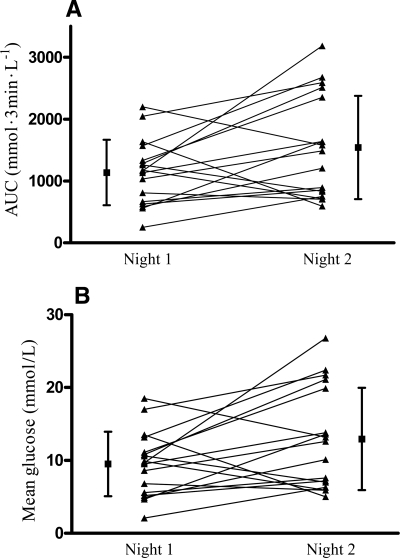
Figure 2.
Nocturnal CGM data for the 6-h period from midnight to 6:00 a.m. for day on (night 1) and day off (night 2) dialysis, expressed as AUC glucose (A) and mean glucose (B). ▲—▲, data for individual subjects; ■, mean ± SD for each 24-h period. A: Mean ± SD area under the 3-min glucose curve for the whole study group was 1,541 ± 834 mmol · 3 min−1 · l−1 for the night of the day off dialysis (night 2) vs. 1,137 ± 529 mmol · 3 min−1 · l−1 for the night of the day on dialysis (night 1) (P < 0.05). B: Mean ± SD CGM glucose values for the whole group were 12.9 ± 7.0 mmol/l on night 2 vs. 9.5 ± 4.4 mmol/l on night 1.

