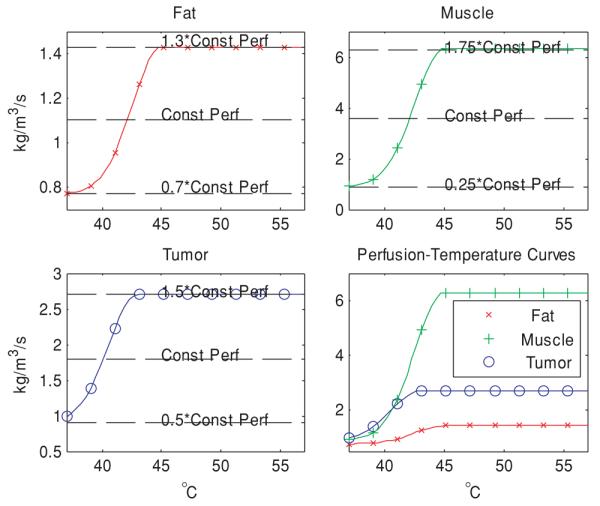
Figure 2.

Curves modeling the perfusion–temperature relationship in fat, muscle and tumor, attempting to mimic the trend observed in Song's experimental data. In developing these functions, we assumed that perfusion increases with temperature in all tissues, ranging from 30% below to 30% above the constant perfusion value of fat, ±75% for muscle and ±50% for tumor (see table 1).
