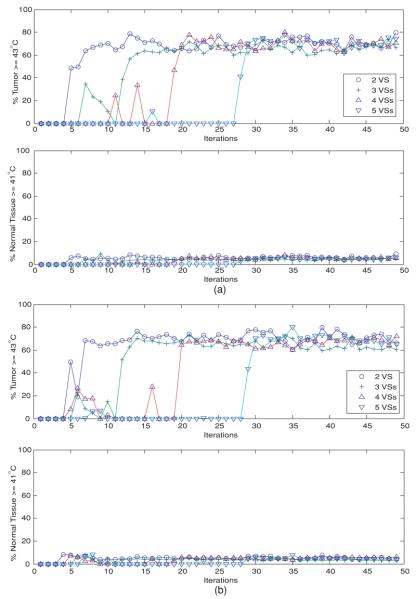
Figure 3.
(a) Temperature-dependent perfusion: the percentages of heated tumor volume (T ⩾ 43 °C) and normal tissues (T ⩾ 41 °C), when the initial driving vector is the minimum eigenvector of the linear model constructed from the reduced subspaces spanned by the first 2–5 orthonormal virtual sources of model 3: the deviated pure-muscle lower leg models with constant perfusions. Note that the computed temperature distribution uses the standard model with temperature-dependent perfusion. (b) Temperature-dependent perfusion: the percentages of heated tumor volume (T ⩾ 43 °C) and normal tissues (T ⩾ 41 °C), when the initial driving vector is the minimum eigenvector of the linear model constructed from the reduced subspaces spanned by the first 2–5 orthonormal virtual sources of model 4: the shifted-tumor-position models with constant perfusions. Note that the computed temperature distribution uses the standard model with temperature-dependent perfusion.

