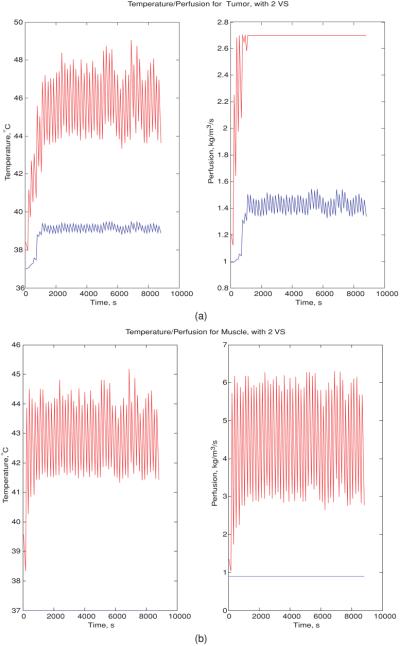
Figure 7.
(a) Variation in the maximum (red)/minimum (blue) temperature/perfusion in the tumor at each feedback iteration step, when the initial driving vector is the minimum eigenvector of the model constructed from the reduced subspace spanned by the first two orthonormal virtual sources of the constant-perfusion shifted-tumor-position model: model 4. (b) Variation in the maximum (red)/minimum (blue) temperature/perfusion in muscle at each feedback iteration step, when the initial driving vector is the minimum eigenvector of the linear model constructed by the reduced subspaces spanned by the first two orthonormal virtual sources of the constant-perfusion shifted-tumor-position model, model 4.

