
Fig. 1.
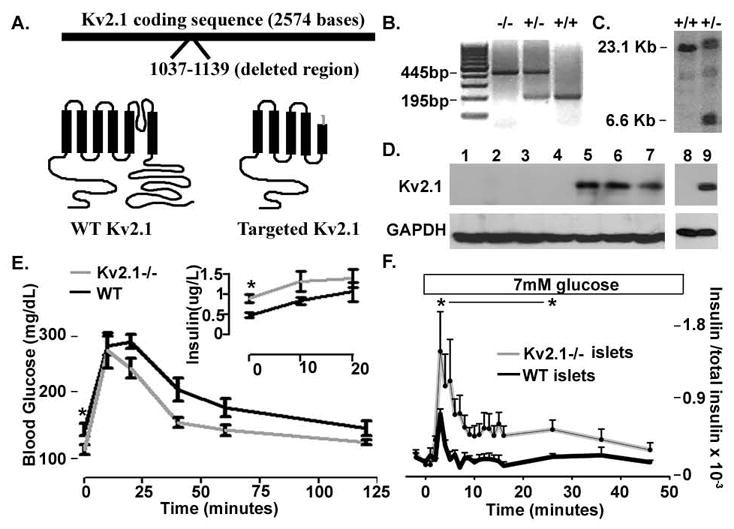
Kv2.1 knockout animals show aberrant glucose homeostasis. (A) Cartoon of the Kv2.1 targeted gene disruption and the resulting disrupted protein structure in grey versus WT in black. (B) PCR products from homozygous knockout, −/−, heterozygous, +/−, and control, +/+, animals with primers specific to the surrounding Kv2.1 gene disruption sequence and one primer specific to the targeting sequence. (C) Southern blot probed with a Kv2.1 specific probe run with genomic DNA from control,+/+, and targeted, +/−, embryonic stem cells cut with an endonuclease that removes part of the Kv2.1 sequence and the targeting cassette. (D) Western blot run with Kv2.1−/− brain extracts lanes 1–4, control brain extracts lanes 5–7, Kv2.1−/− islets lane 8, and control islets lane 9. (E) Glucose tolerance test on Kv2.1−/−, grey line, and control, black line, animals. Serum insulin levels from Kv2.1−/−, grey line, and control, black line, animals are shown in the inset. n= 10 each, * P<0.05. (F) Islet insulin secretion during the 7mM glucose treatment, boxed above, the islets are in 2mM glucose previous to stimulation, + SDEV (n=10 islet sets and 3 insulin assays each).