Figure 4.
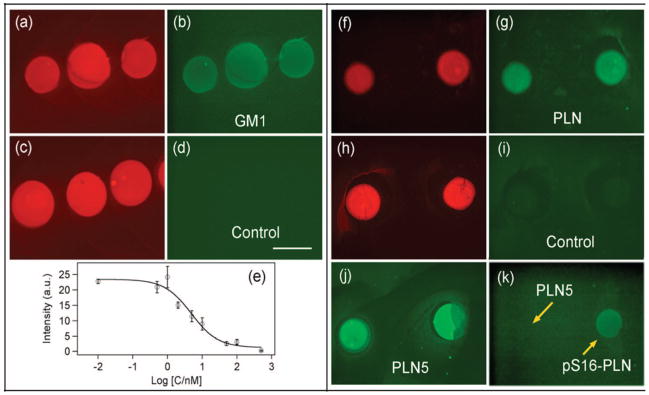
Fluorescence microscopic images of SLB arrays deposited on the cholesteryl-PEG/glass surface θCh = 0.3/cm2). Left: Arrays with (a and b) or without (c and d) 2% ganglioside GM1. The red channel shows TR-DHPE (0.5%), and the green channel detects the binding of FITC-CTB. (e) Competitive assay of the binding of FITC-CTB to the GM1 containing an SLB array from a solution containing 1 nM FITC-CTB and varying concentrations (C/nm) of CTB without dye label. Right: (f and g) Spots containing PLN with a protein/lipid ratio of 1:100; (h and i) controls without protein; (j) spots containing PLN5 with a protein cluster/lipid ratio of 1:500, and (k) spots containing PLN5 (left) with a protein cluter/lipid ratio of (1:500) and pS16-PLN (right) with a ratio of (1:100). The red channel is for TR-DHPE, and the green channel, for the FITC-2nd antibody. A primary antibody against PLN is used for (g, i, j) and that specific for pS16-PLN in (k). The scale bar in (d) is 400 μm.

