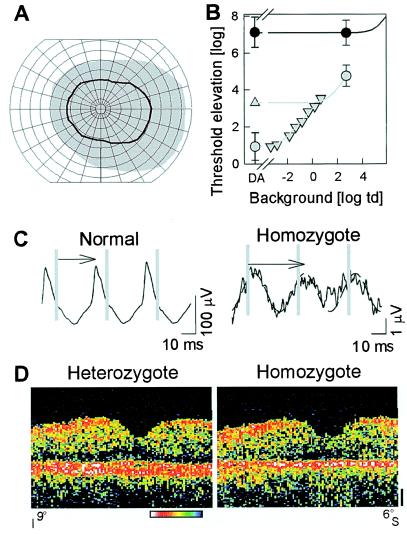
Figure 4.
Human phenotype of putative null mutation in RPE65. (A) Kinetic visual fields with a V-4e test target in the homozygote (black line) compared to normal (gray region); concentric circles are at 10o intervals and meridians are at 15o. (B) White stimulus thresholds of the homozygote (●) shows >6 log units of elevation under dark-adapted (DA) and >2 log units of elevation under light-adapted (2.7 log troland) conditions. Normal thresholds (gray symbols) on increasing background intensities (▿) and during the cone plateau following a full bleach (▵) are fit with empirical models of background adaptation (gray lines) to define the rod- and cone-mediated limbs. The normal cone adaptation model was shifted by 3.8 log units to the right and up to fit the patient data (solid line). (C) Cone flicker ERGs in homozygote are reduced ≈100-fold in amplitude and abnormally delayed in timing (arrows). Vertical gray lines mark stimulus times. A 29-Hz sinusoid was fitted to the homozygote data (dashed lines) to estimate amplitude and timing of the small signal. (D) Vertical OCT cross-sectional retinal images through the fovea (9o inferior to 6o superior retina) show central retinal structure is generally intact in the homozygote (compared to a heterozygous sibling) except for thinning of the outer retina-choroid complex, the red/white band toward bottom of panel. Optical reflectivity of retinal tissue is shown on a logarithmic pseudocolor scale: red and white are high reflectivity and blue and black are low reflectivity. Vitreous is toward the top and sclera is toward the bottom.

