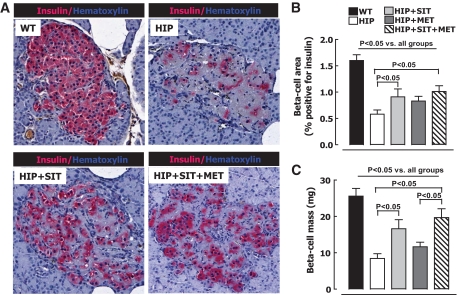
FIG. 2.
A: Typical islets from wild-type (WT) rats, HIP rats, HIP rats treated with sitagliptin (HIP+SIT), and HIP rats treated with sitagliptin and metformin (HIP+SIT+MET) stained for insulin (pink) and hematoxylin (blue). β-Cell area (B) and mean β-cell mass (C) after 12-week treatment with 60% high-fat diet in wild-type rats (n = 7), HIP rats (n = 8), HIP rats treated with sitagliptin (HIP+SIT; n = 8), HIP rats treated with metformin (HIP+MET; n = 9), and HIP rats treated with combination therapy (HIP+SIT+MET; n = 8). Data are the means ± SE. (A high-quality digital representation of this figure is available in the online issue.)

