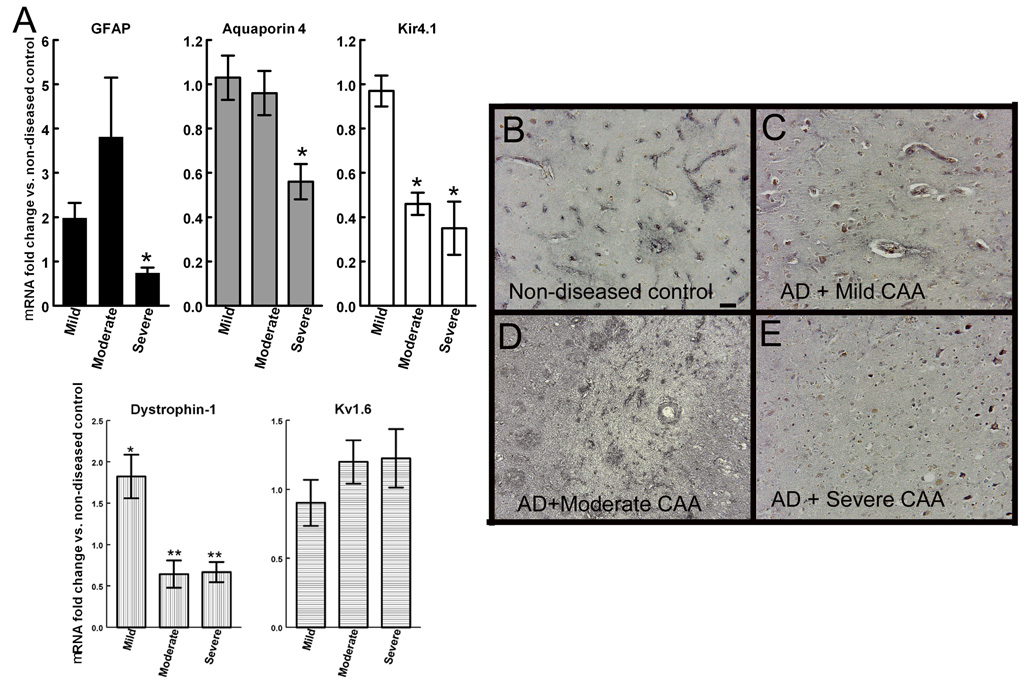
Figure 8.
Neurovascular unit disruptions are seen in Alzheimer’s disease tissue. Panel A shows RNA expression levels of GFAP, aquaporin-4, Kir4.1, dystrophin 1 and Kv1.6 from AD tissue with mild, moderate and severe CAA. Data are shown as the average fold change vs. non-diseased control ± SEM. * indicates P<0.05, ** indicates P<0.01 compared to age-matched non-disease controls. Panels B–E show aquaporin-4 immunohistochemistry on human tissue sections from non-diseased brain (B), AD with mild CAA (C), AD with moderate CAA (D) and AD with severe CAA (E). 200× magnification, scale bar = 12.5µm.

