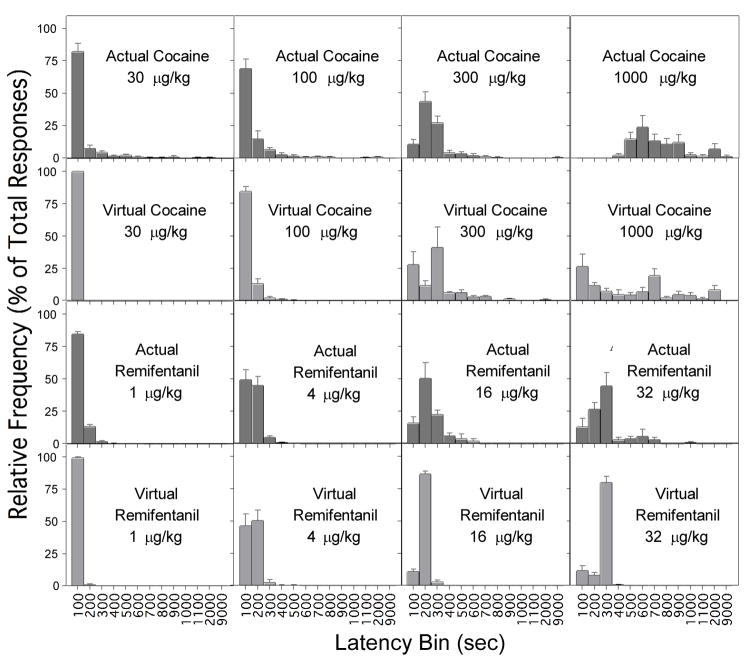
Fig. 2.
Frequency distributions of response latencies for actual cocaine (upper row), virtual cocaine (second row), actual remifentanil (third row), and virtual remifentanil (bottom row). Data for actual cocaine and actual remifentanil shown in Figs. 2–6 are from the study of Panlilio et al. (2003).

