Figure 2.
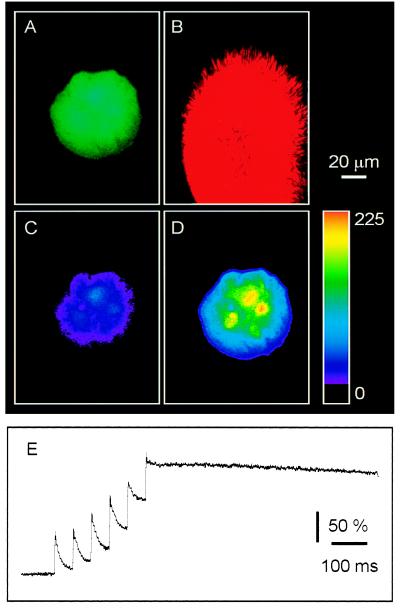
Photolysis of NP-EGTA increased [Ca2+]i in all astrocytes within single microislands. Cells were coloaded with the calcium indicator fluo-3 and the calcium cage NP-EGTA. (A) The astrocytes of interest were localized by using the fluorescence of fluo-3. (B) After locating the astrocytic microisland of interest, the optical fiber was brought into the field of view. To control the position of UV photolysis, a diode laser, which acted as a searchlight, was enabled. The position of UV pulses corresponds with the position of the red illumination that is shown here. Exposure of the astrocytic microisland to UV pulses delivered through the optical fiber elevated internal calcium level because of photolysis of NP-EGTA. (C) A pseudocolor representation of the resting calcium level. (D) The calcium level after photolysis. Color scale indicates linear pseudocolor representation of fluorescence intensity ranging from 0 to 255 units. (E) The change in [Ca2+]i was also monitored, in a separate experiment, with a photomultiplier tube. Exposure to a train of UV pulses evoked a staircase-like increase in [Ca2+]i, indicating that multiple pulses of UV light can be used to control the level of [Ca2+]i experimentally. Changes in calcium are represented as percentage of ΔF/Fo.

