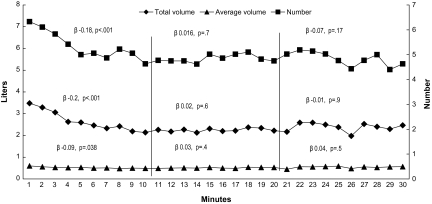
Figure 2.
Mean total smoke volume (diamonds), puff volume (triangles), and puff number (squares) for each minute of the first 30 min of the waterpipe tobacco smoking session. Standardized linear regression coefficients (β) and their p value for the relation between session time and average puffing parameters for each 10-min portion are shown, together with the number of participants’ data analyzed in each portion.

