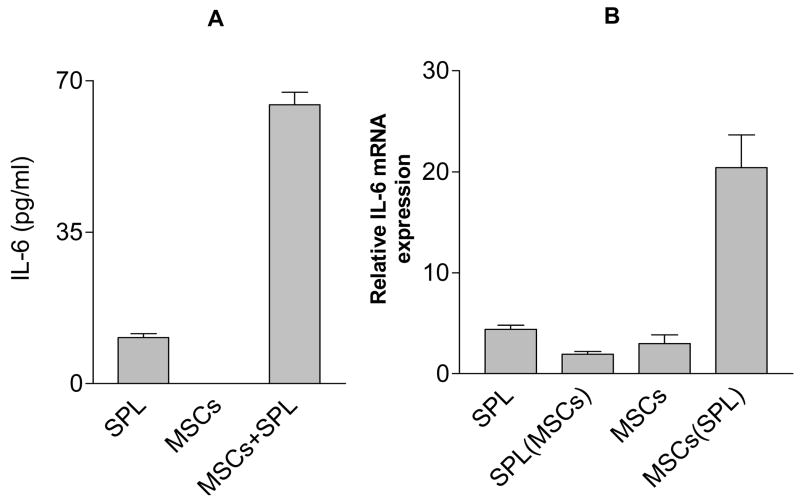
Figure 4. Direct interaction between splenocytes and MSCs induced the expression of IL-6 by MSCs.
(A) MSCs and splenocytes were cultured separately or together for 3 days and the amount of IL-6 in the supernatant measured using Bio-Plex analysis. (B) Splenocytes and MSCs were then harvested separately from either monoculture or the co-culture (MSCs are adherent) and expression of IL-6 mRNA was determined by real time PCR. Results shown as fold increase relative to β-actin. All values represent means ± SD of three separate samples. Data are representative of two independent experiments. SPL (MSC) = splenocytes from co-culture with MSCs; MSC (SPL) = MSCs from co-culture with splenocytes.

