
Fig. 3.
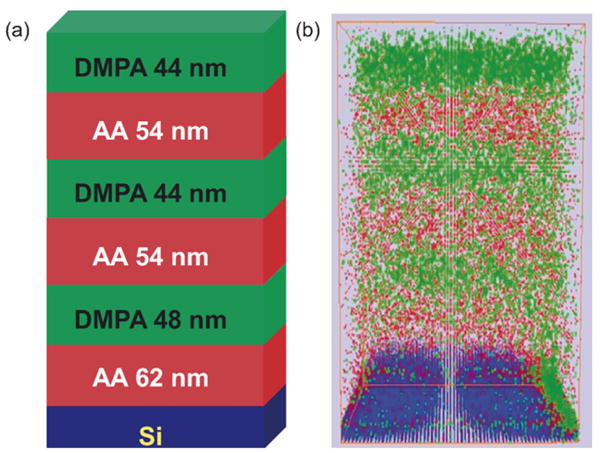
(a) Schematic drawing of LB20-6 and the DMPA blocks are represented by green, AA blocks are represented in red and Si in blue and (b) the chemical structure rebuilt from the SIMS depth profile images with green showing the DMPA signal, red showing the AA signal, and blue showing Si signal. (For interpretation of the references to color in this figure legend, the reader is referred to the web version of the article.)