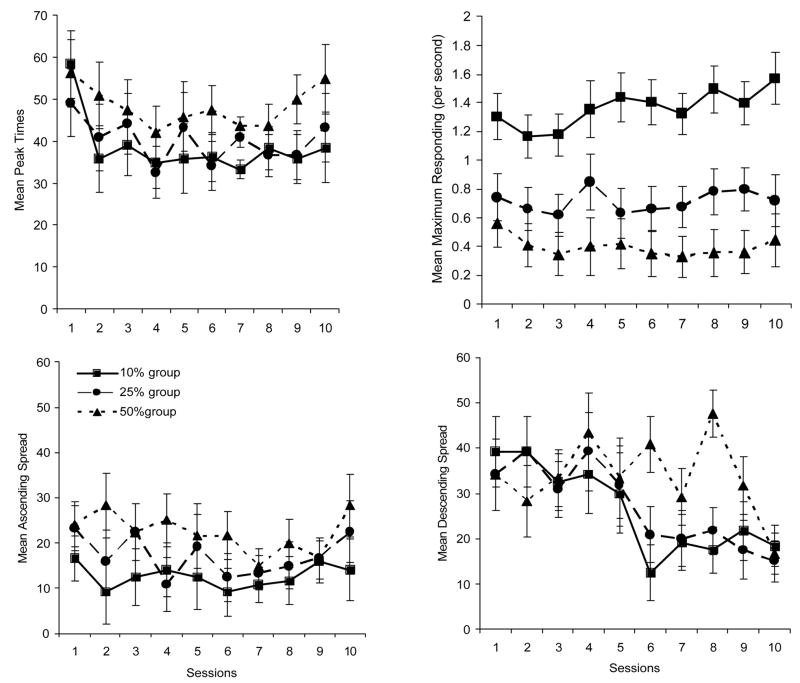
Figure 5.
Mean points of peak responding as a function of group and session (top left graph). Mean maximum response rate as a function of group and session (top right graph). Mean ascending spread as a function of group and session (lower left graph). Mean descending spread as a function of group and session (lower right graph).

