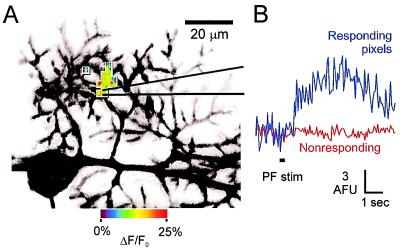
Figure 3.
Range of PF activation assessed by calcium imaging. (A) The region of PF activation was identified by SVD analysis of calcium signals produced by a burst of PF activity (10 stimuli, 50 Hz). Differences in the response mode of more than 1 SD above zero were defined as responding (boxed area). The change in fluorescence for responding pixels are indicated in the pseudocolored scale shown at bottom. (B) Mean time course of fluorescence changes evoked by the PF stimulus in responding (blue) and nonresponding (red) pixels.

