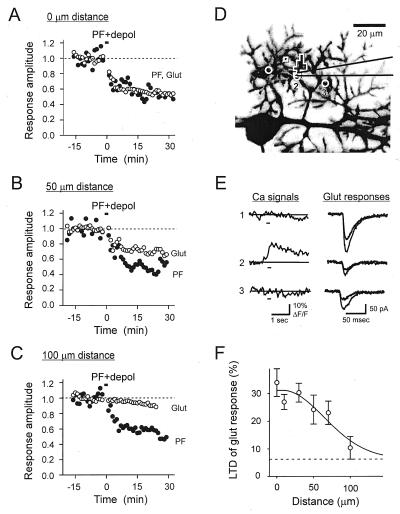
Figure 6.
Long-term depression of AMPA receptors spreads beyond the site of synaptic activity. (A–C) Depression of glutamate receptors depends on the distance between the uncaging spot and active PFs. Bars indicate the period of pairing PF activation with depolarization (PF + depol). Filled symbols represent the amplitude of EPSCs resulting from PF activity, whereas open symbols indicate the amplitude of currents produced by uncaging glutamate. When glutamate was uncaged at the same place as the PFs were activated (0 μm, A), the glutamate-induced currents depressed but when glutamate was uncaged 100 μm away from the site of PF activity (C) there was little depression of these currents. Each panel shows data from a different cell. (D–E) Simultaneously monitoring LTD at several sites. (D) Diagram of the experiment, showing the same cell used for the singular value decomposition analysis in Fig. 3E. (E Left) Ca signals recorded at the three sites indicated in D during stimulation of PFs (at bars). Only site 2 responded to the focal PF activity. (E Right) Following induction of LTD, glutamate responses depressed at all three sites indicated in D. (F) Superimposed traces are responses (average of 5) recorded 5 min before and 20 min after LTD induction. Relationship between the average decrease in glutamate response, measured 20 min after pairing in 14 cells, and the distance that these responses were elicited from the PF stimulus electrode. Dashed line indicates rate of run-down of glutamate responses in the absence of LTD (Fig. 5A) and smooth curve is a Gaussian function with a radius (at half-maximal amplitude) of 56 μm.

