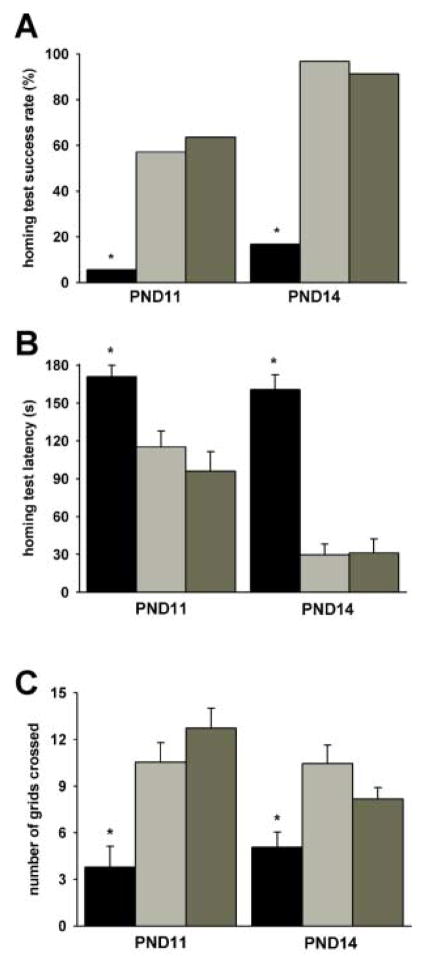
Figure 6. Homing test on SMNΔ7 SMA mice.
The homing test was performed on SMNΔ7 SMA mice (black bars) as well as their carrier (light grey bars) and normal (dark grey bars) littermates at PND11 and PND14. As shown in (A), significant fewer SMNΔ7 SMA mice were able to successfully enter the home field within the allotted time (3 min) while most non-SMA littermates successfully completed the test. The amount of time needed to enter the home field (homing test latency; B) was greater for SMNΔ7 SMA mice than for non-SMA littermates. The number of grids crossed during the homing test (C) was significantly lower for SMNΔ7 SMA mice than for non-SMA littermates. Legend; *p < 0.05 for SMA vs. normal mice and vs. carrier mice.

