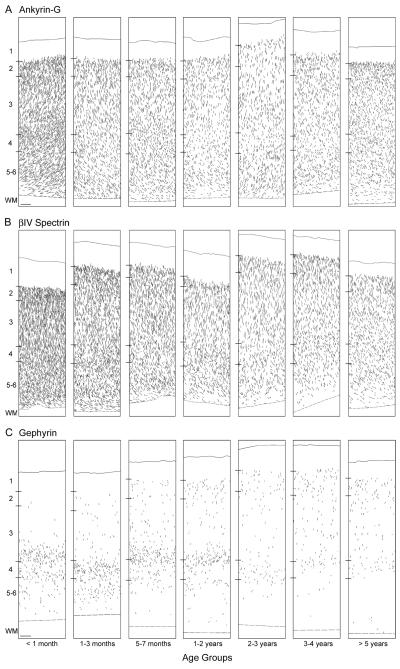
Figure 6.
Neurolucida drawings of a representative animal from each of the 7 age groups depicting the laminar distribution of ankyrin-G- (A), ßIV spectrin-SD- (B) and gephyrin- (C) immunoreactive AIS in area 46 of monkey prefrontal cortex. Each drawing represents a 450 μm-wide traverse from the pial surface (solid lines) to the layer 6-white matter border (dashed lines). Hash marks indicate the location of laminar boundaries; WM indicates white matter. Scale bar = 100 μm in C (applies to A,B,C).

