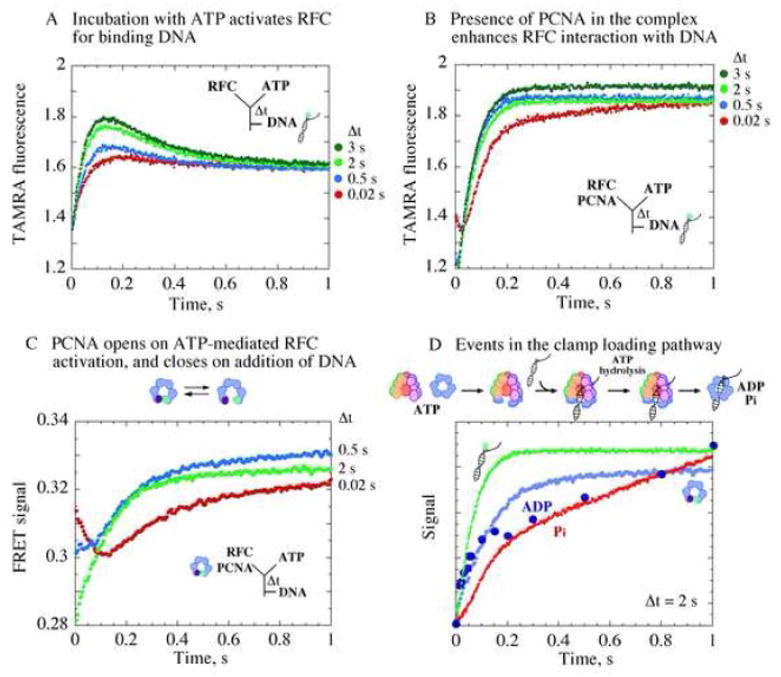
Figure 5.

Formation of an active RFC•ATP•PCNA(open) complex that binds ptDNA for clamp loading. (A) Changes in fluorescence intensity of TAMRA-labeled ptDNA on binding RFC show increasing interaction correlated with increasing RFC, ATP pre-incubation time (Δt). (B) Presence of PCNA during pre-incubation enhances the interaction. (C) Kinetics of PCNA opening/closing measured by FRET between Tryptophan and AEDANS at PCNA(WCAEDANS) clamp interfaces. At shortΔt (0.02 s, red trace), PCNA opening is detected at first after ptDNA addition (FRET decrease) followed by PCNA closing (FRET increase). At longer Δt, PCNA is completely opened already (2 s, green trace), and only its closure is detected after ptDNA addition (kPCNA_Close ~ 5 s−1). (D) Overlay of data from PCNA opening/closing, DNA binding/release, and ATPase kinetics shows rapid ptDNA binding to RFC•ATP•PCNA(open) complex formed during pre-incubation (Δt = 2 s), triggering ATP hydrolysis, followed by PCNA clamp closure, release of Pi and other products, and catalytic turnover.
