
FIG. 1.
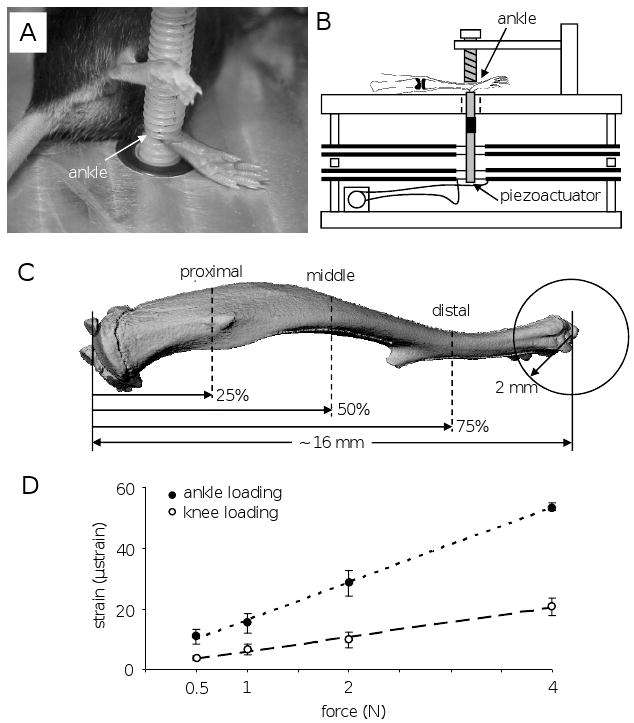
Experimental setup. (A) Mouse on a loading table for ankle loading. (B) Schematic diagram illustrating the piezoelectric mechanical loader. (C) Location of three cross-sections for bone morphometry. (D) Strain measurements with ankle and knee loading. The best-fit regression line is: y = 12.4 x + 3.7 with ankle loading (r2 = 0.99), and y = 4.8 x + 1.2 with knee loading (r2 = 0.99).