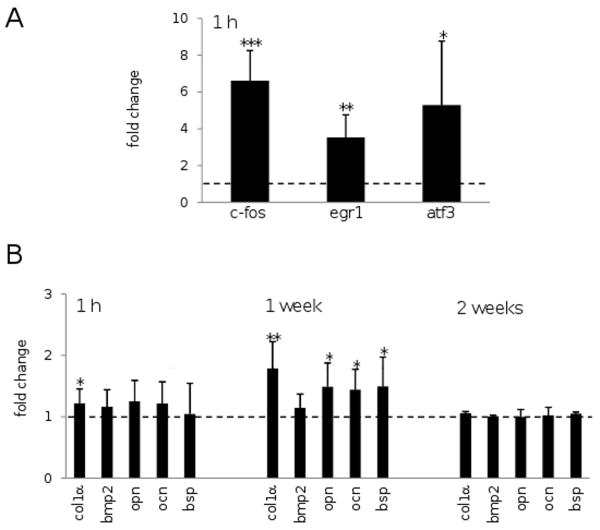
FIG. 7.
Alterations of mRNA levels with ankle loading. The harvest time (1 h, 1 week, or 2 weeks) is indicated from the last loading (day 3). (A) Elevated mRNA levels of c-fos, egr1, and atf3 at 1 h after the last loading for 7 mice. The amount of increases and decreases is color-coded in red and green, respectively. (B) Altered mRNA levels of col1α (type I collagen 1α), bmp2 (bone morphogenic protein 2), opn (osteopontin), ocn (osteocalcin), and bsp (bone sialoprotein) at three different time points after the last loading (7 mice at 1 h, 7 mice at 1 week, and 3 mice at 2 weeks). Upregulation and downregulation are colored coded in red and green, respectively.

