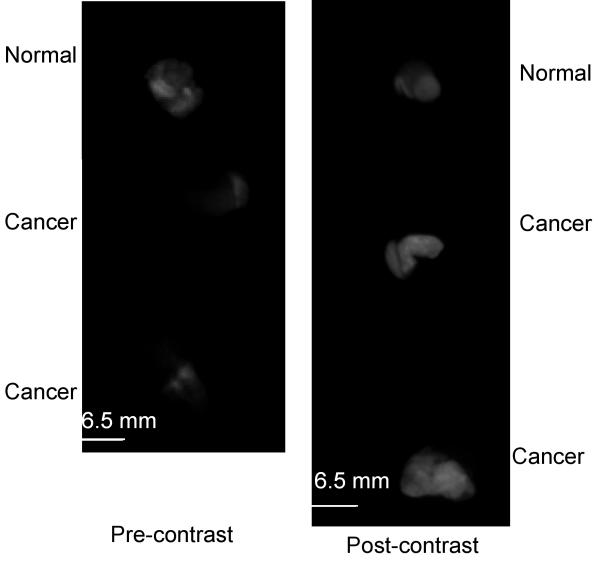
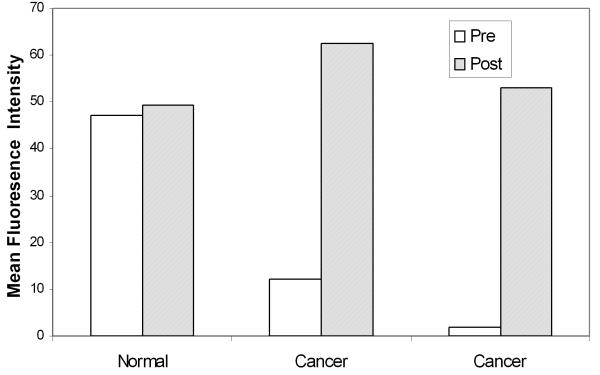
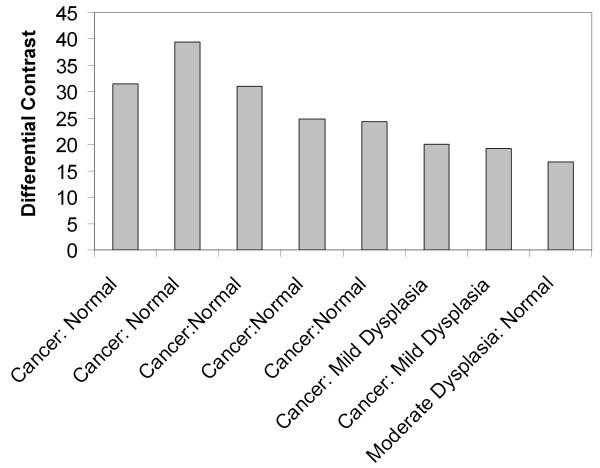
Figure 5.
(a): Widefield fluorescence images of three oral specimens obtained pre- (left) and post- (right) labeling with 2-NBDG. The top specimen was clinically and histologically normal and the bottom two specimens were clinically abnormal and diagnosed as invasive cancer. (b): Mean fluorescence intensity calculated from pre- and post-contrast widefield images of intact biopsy specimens shown in (a). (c): Differential contrast measure based on the ratio of the increase in the mean fluorescence intensity of clinically abnormal epithelium to that of clinically normal epithelium from paired samples in 8 patients following labeling with 2-NBDG. Results are plotted as a function of histopathologic diagnosis. Scale bar represents 6.5 mm.


