
Figure 3.
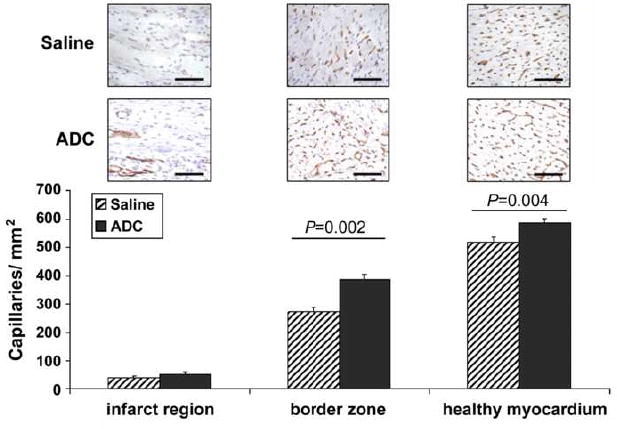
Myocardial capillary density within the infarcted, border and healthy regions of hearts 12 weeks post MI demonstrated significantly more capillaries in the ADC-treated rats when compared with the saline controls. Representative images of CD31 immunostaining (red) of each zone for both ADC-treated and control rats are shown directly above the graph. Scale bars equal 100 μm; 20× magnification.