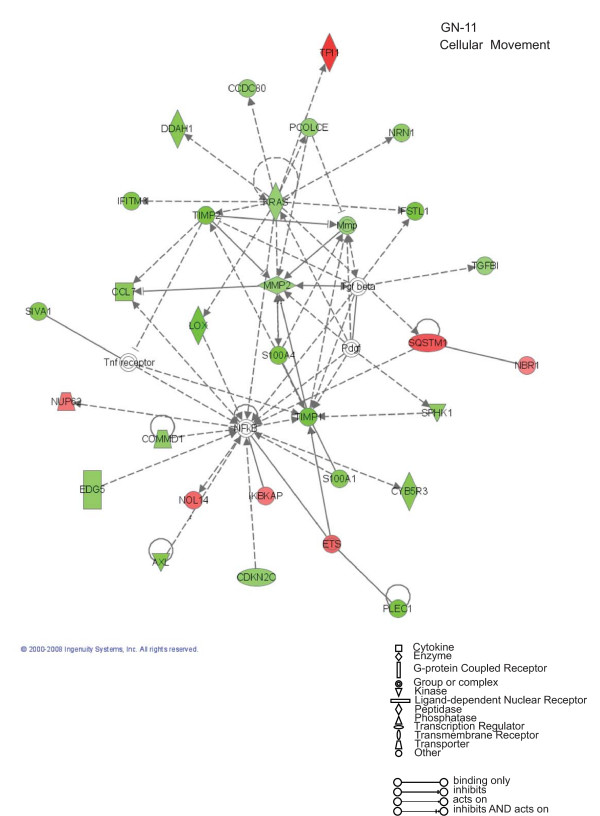
Figure 4.
Cellular Movement: Ingenuity Pathway Analysis for GN-11 neurons. Specific functional networks of the newly identified AP-2α-regulated genes were obtained using Ingenuity Pathway Analysis systems and "cellular movement" is one of the two main networks found. Gene products are represented as nodes and biological relationships between two nodes as a line. Continuous lines indicate direct interactions, while dashed lines represent indirect connections. Shapes of nodes symbolize functional classes of gene products (see the figure legend). The green and red symbols represent down- and up-regulations, respectively, while the white symbols indicate genes absent in the dataset but related with the dataset genes.

