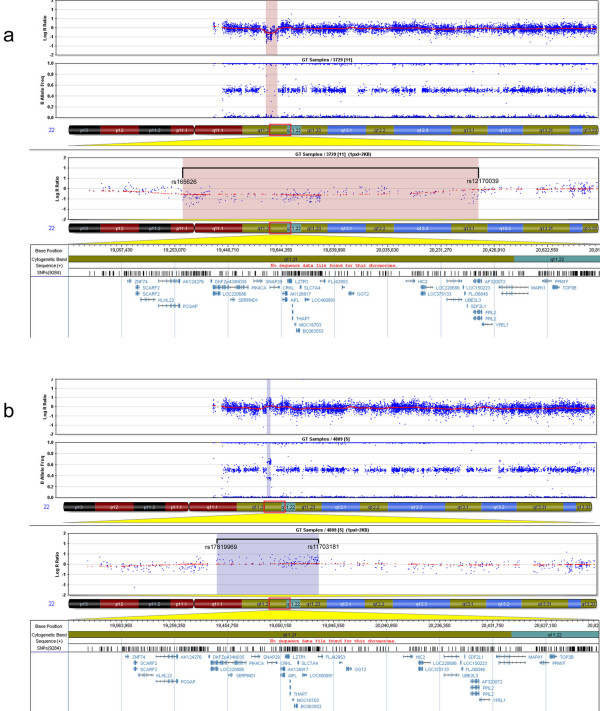
Figure 3.
Array-CGH SNP genotyping of Patients 1 and 2. Chromosome 22 plot of Patients 1 (a) and 2 (b). The upper panels show the genic dosage (Log R ratio) and the homozygous/heterozygous distribution (B allele frequency) for all the SNPs genotyped. Both parameters are used together for interpretation of deletions and duplications. The region showing copy number alterations is zoomed in below, indicating the flanking SNPs and the genes in the region. A copy number decrease and loss of heterozygosity was found in Patient 1 (pink shading, a), whereas a copy number increase with four different allele populations was found in Patient 2 (blue shading, b).

