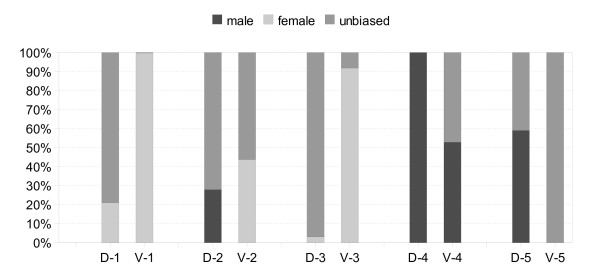
Figure 5.
Gender-biased expression ratios within co-expression clusters. Expression profiles (1–5) before (D) and after (V) entry into vitellogenesis are shown. Gender-biased expression was calculated as genes with a 2-fold greater level of expression in either sex (q < 0.05), while unbiased expression was calculated as the remainder.

