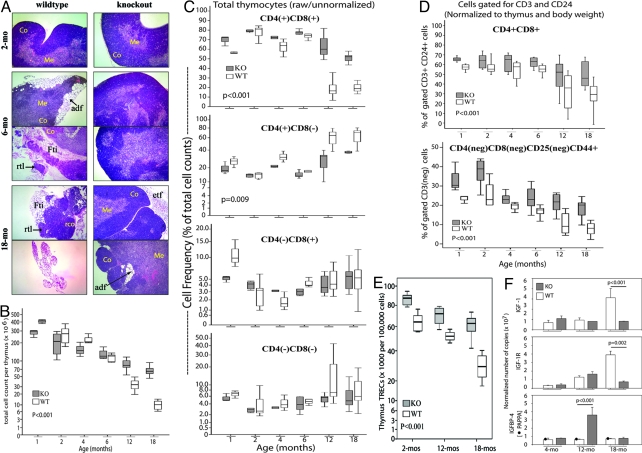
Fig. 1.
PAPPA−/− mice are resistant to thymic atrophy with aging. (A) Frozen sections of wild-type (WT) and PAPPA−/− (KO or knockout) thymi were stained with H&E and analyzed by microscopy. (Magnification: 20×.) Micrographs shown were representative of 5–7 thymi per group, at 3 consecutive sections per thymus. Co, cortex; Me, medulla; adf, adipocyte infiltrate; etf, extrathymic fat tissue; Fti, intrathymic fat; rco, residual thymic cortex; rtl, residual thymic lobe. (B) Thymocyte suspensions (n = 5–12 mice per group) were counted. Data shown are box/whisker plots of raw cell counts. Boxes mark the 25th and 75th percentile values; the line inside each box is the median; and whiskers indicate the spread of 5th and 95th percentiles; the P value was determined by ANOVA. (C) Thymocyte suspensions were analyzed by flow cytometry. Box/whisker plots (10–17 mice per group) shown are the raw percentages of cells expressing CD4, or CD8 or both, without gating for CD3 or CD24. (D) The cytometry data set in C were reanalyzed by gating for CD3 and CD24, and then for the expression of CD4, CD8, and CD25. Data shown are box/whisker plots of CD3+CD24+, DP cells (Upper), and of the immature DN1 thymocytes defined as CD3-CD4-CD8-CD24+CD25-CD44+ (Lower). Data were normalized for thymus and body weight. Box/whisker plots (and P values) in C and D were determined as in B. (E) Thymic TREC levels (7 mice per group) were measured by quantitative PCR. Box/whisker plots from 100,000 cells (and P value) were determined as in B. (F) Whole thymi (3–5 per group) were examined for levels of IGF, IGFR, and IGFBP4 transcripts by quantitative RT-PCR. Level of PAPPA in wild-type mice was also measured; the correct size transcript was undetected in PAPPA−/− mice as expected. Bar graphs are means (±SEM) normalized to ribosomal L19 transcript. P values of the indicated group comparisons were determined by Mann–Whitney U test.

